Instruments templates like Allocations or Leaks run in Deferred recording mode by default. And it makes sense, because it would probably be too hard for Instruments to render results in realtime. But it creates this weird disconnect where you look at the graph later and think:
“okay… but what was my app actually doing here?”
What did help — using signposts / Points of Interest not for timing, but just as markers. Basically sprinkling “this is happening now” events in the code. We usually use signposts and Points of Interest to measure how long something takes — like a function call. But here they just represent whatever the app is doing at a given moment.
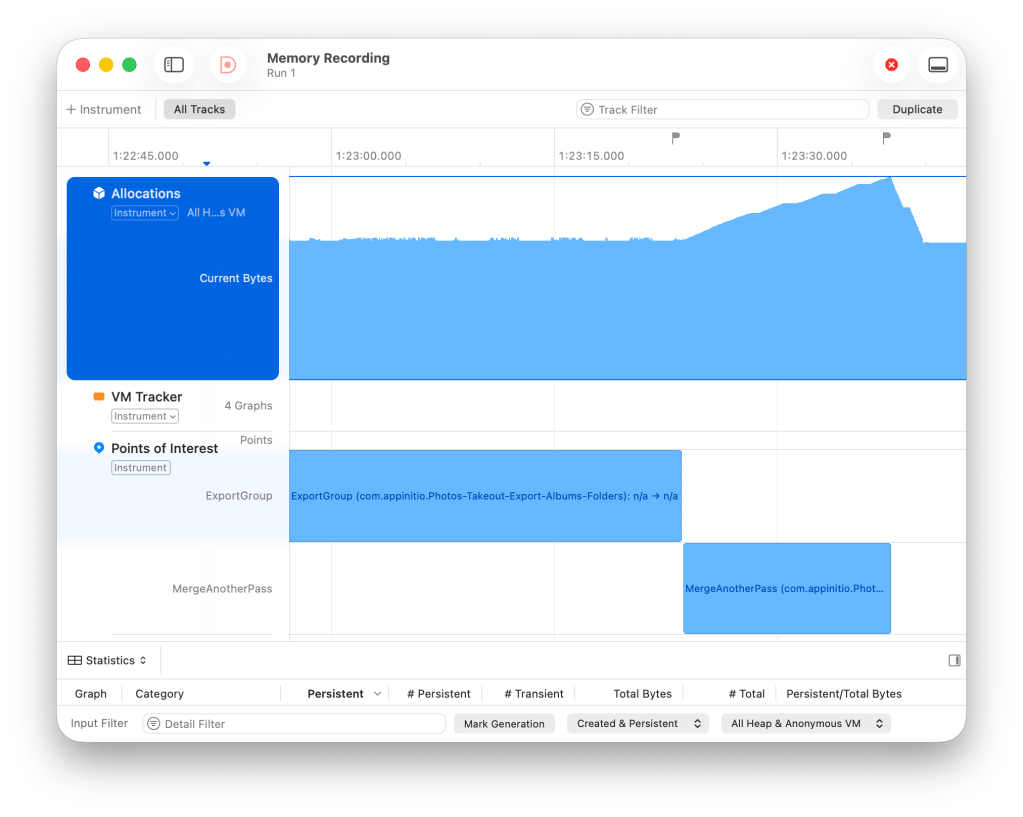
Then in Instruments you suddenly get context aligned with the graph. Like, oh, this spike was during X. For example, on the screenshot below we can clearly see that something happened during “MergeAnotherPass”
Recording points of interests could look like this in code:
let signposter = OSSignposter(subsystem: "AppName", category: .pointsOfInterest)
let state = signposter.beginInterval("MergeAnotherPass")
let mergedResults = firstPassResults.mergingAnotherPass(secondPassResults: secondPassResults)
signposter.endInterval("MergeAnotherPass", state)
Don’t forget that in order for Points of Interest to appear in Instruments, the category of OSSignposter should be OSLog.Category.pointsOfInterest or just .pointsOfInterest
Anyway, if you ever feel like Allocations is just a pretty but meaningless chart — this might be the missing piece 👍

Nice post. I didn’t have a need to use Instruments lately, but Points of Interest look like very useful tool
LikeLike